Back to Patterns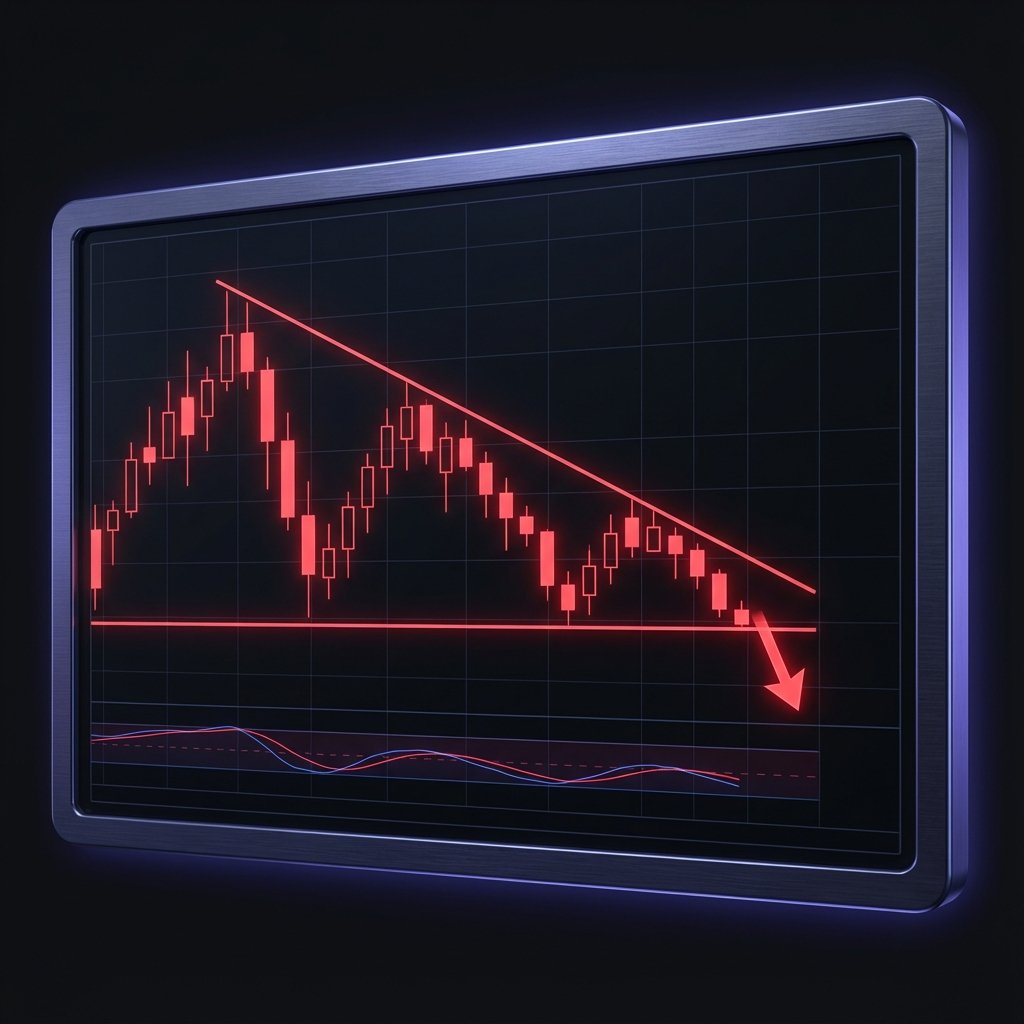
bullish Signal
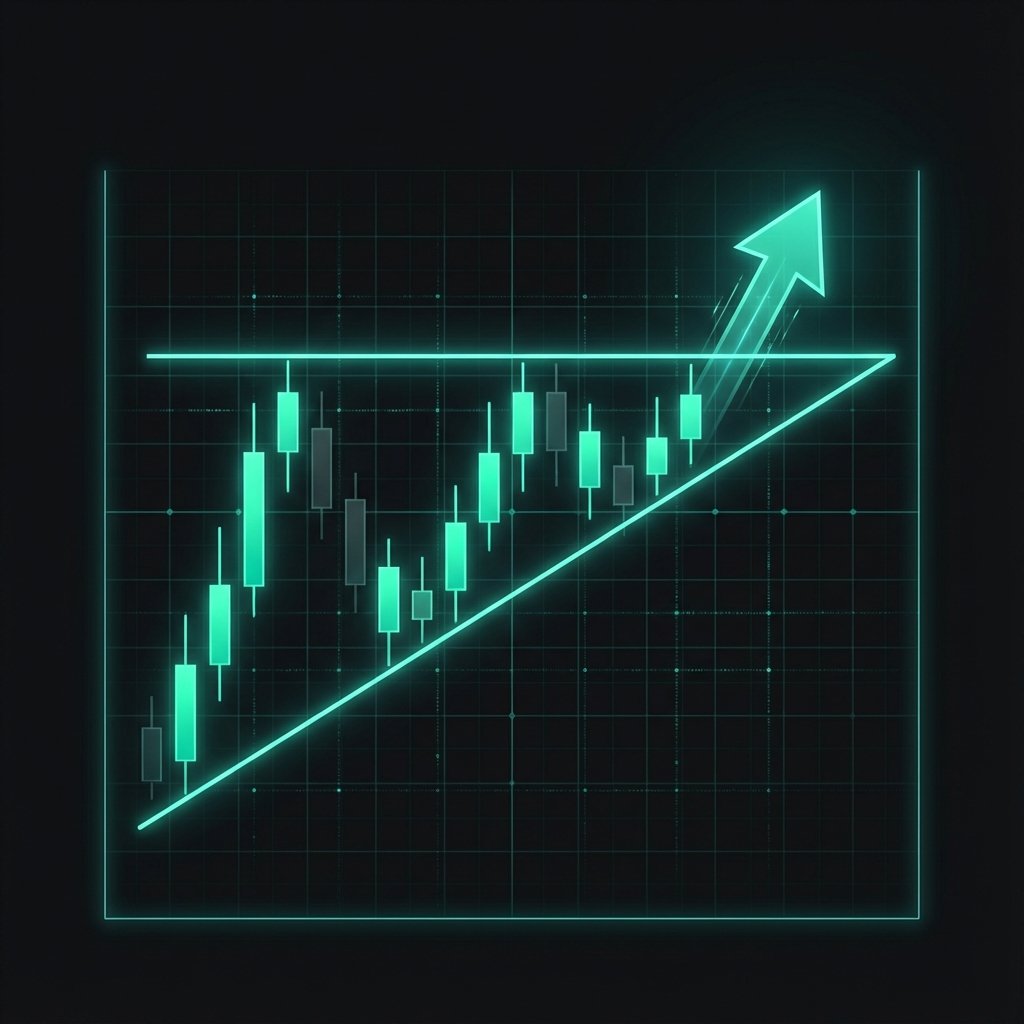
Ascending Triangle
A bullish continuation pattern characterized by a flat resistance line and an ascending support line. Price gets squeezed into the apex before breaking out.
How to Trade
Enter long when price clears the horizontal resistance line with high volume.
Market Psychology
Buyers are becoming increasingly aggressive, pushing the lows higher and higher, while sellers are holding a firm line that eventually breaks.
Next Lesson
Descending Triangle
Technical Diagram
This visual represents the ideal candle formation and breakout points for the Ascending Triangle pattern.