Back to Patterns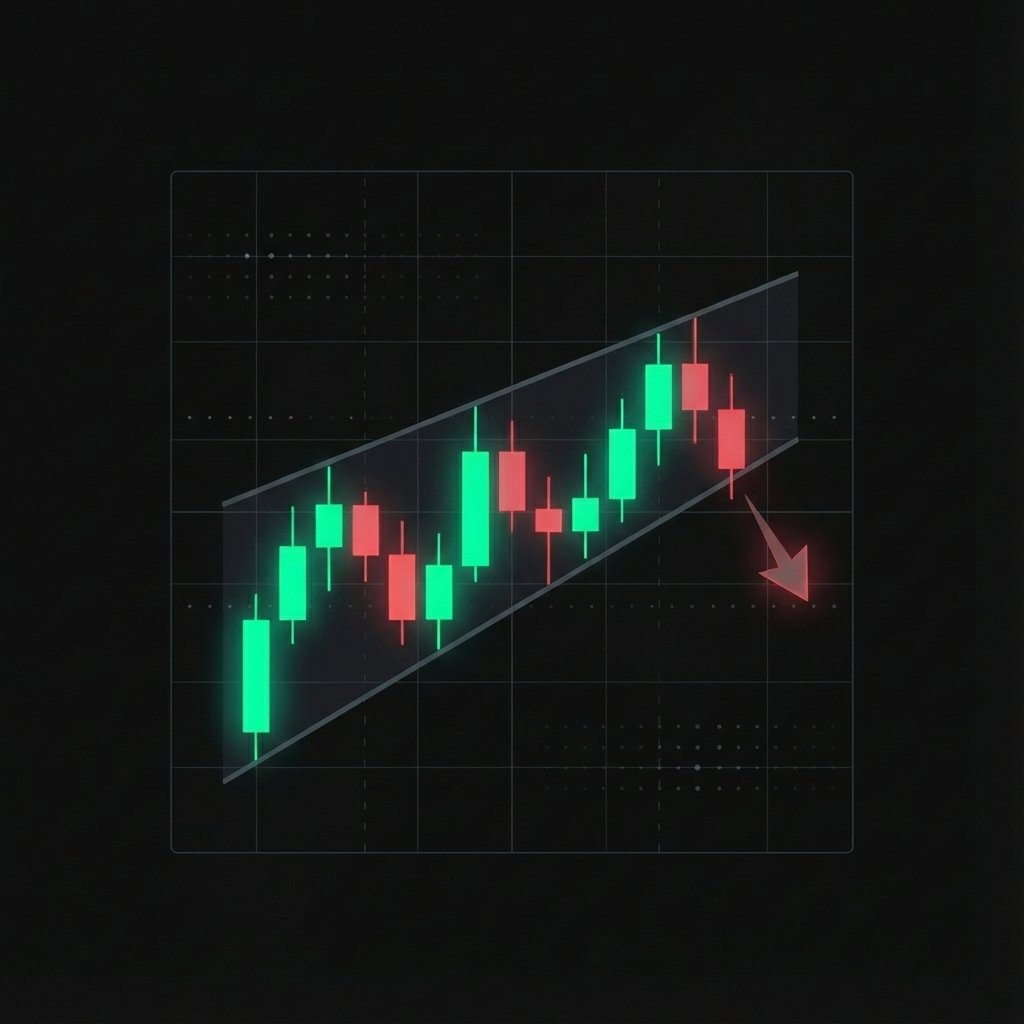
bearish Signal
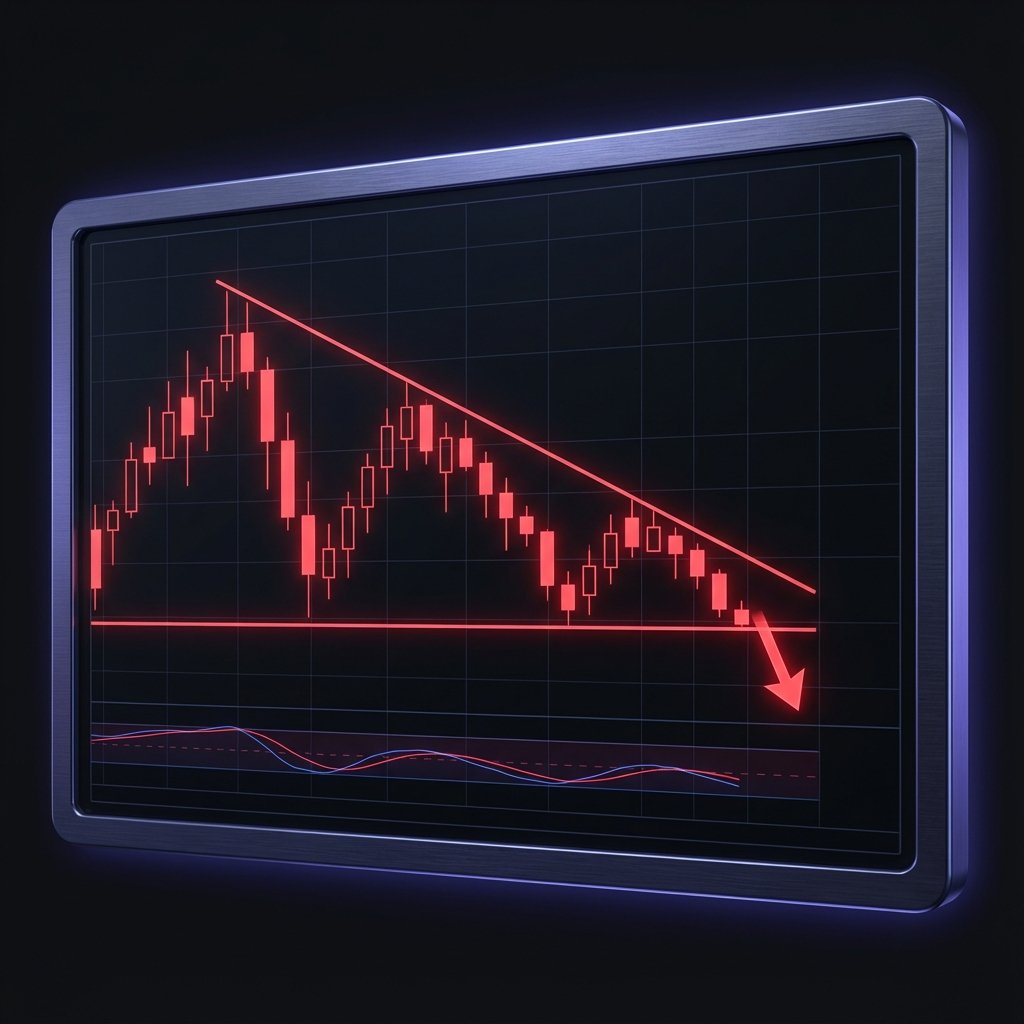
Descending Triangle
A bearish continuation pattern with a flat support line and a descending resistance line. It signals that sellers are in control.
How to Trade
Enter short when price breaks below the flat support line.
Market Psychology
Sellers are willing to sell at lower and lower prices, while buyers are just barely holding the line at support until it finally gives way.
Next Lesson
Rising Wedge
Technical Diagram
This visual represents the ideal candle formation and breakout points for the Descending Triangle pattern.