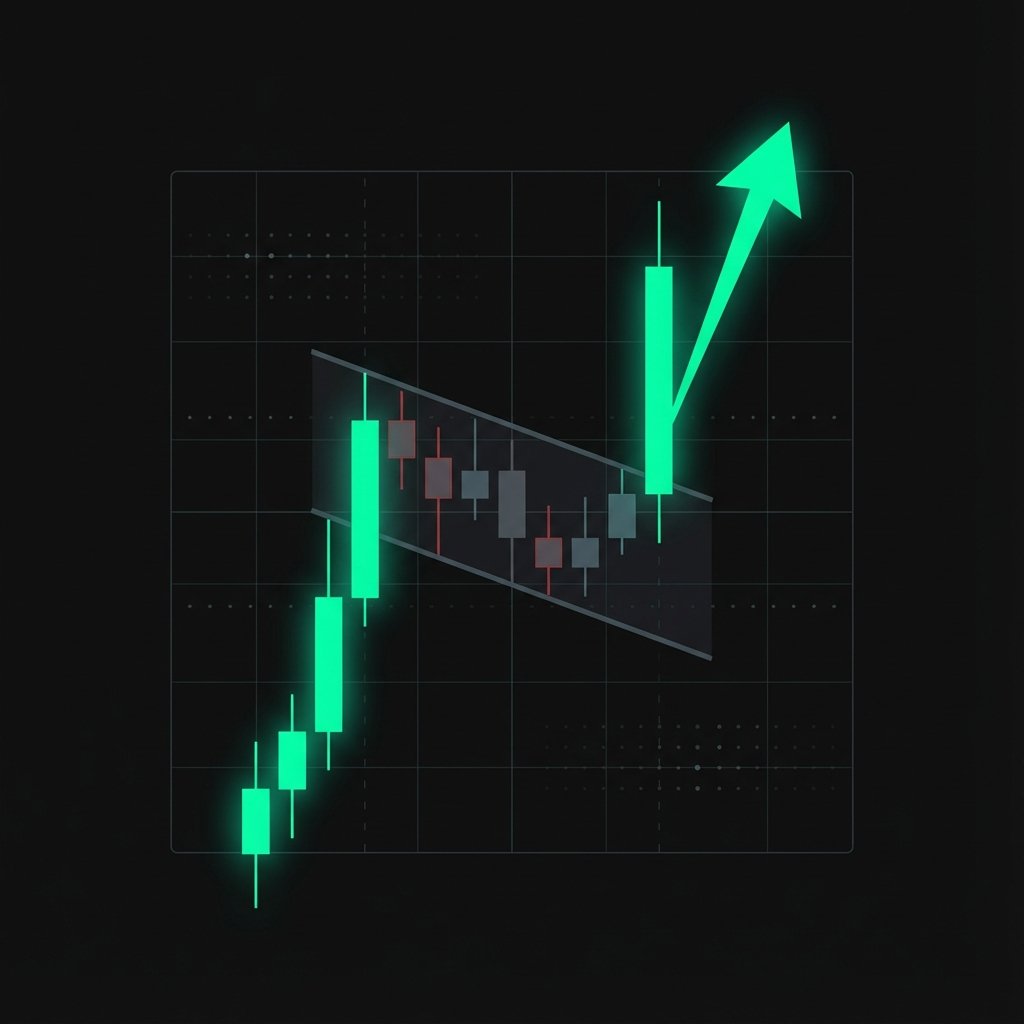
ChartPattern Logo
StocksCryptoCurrenciesLearnWatchlist
Back to Patterns
neutral Signal

Diamond

A diamond pattern combines a broadening formation followed by a symmetrical triangle. Price expands then contracts, forming a diamond shape. It is typically a reversal pattern.

How to Trade

Enter when price breaks out of the diamond. If it appears at a market top, a breakdown is more likely (bearish). At a market bottom, a breakout is more likely (bullish).

Market Psychology

The expanding phase shows growing uncertainty, while the contracting phase shows decreasing volatility as the market prepares for a decisive move. The breakout direction often opposes the prior trend.

Bullish Flag

Next Lesson

Bullish Flag

Diamond Chart Diagram
Technical Diagram

This visual represents the ideal candle formation and breakout points for the Diamond pattern.

Explore Related Markets

Pattern Peers

Atom DiamondJ DiamondCeg DiamondCdw DiamondCsco Diamond

Get Smarter Market Alerts

Join 5,000+ traders receiving our weekly digest of breakout patterns and technical setups. No spam, just alpha.

By subscribing, you agree to our Privacy Policy. Unsubscribe immediately anytime.

ChartPattern Logo

Advanced market intelligence powered by automated technical analysis.

Market

  • Crypto
  • Currencies
  • Communication Services
  • Consumer Discretionary
  • Consumer Staples
  • Energy
  • Financials
  • Health Care
  • Industrials
  • Information Technology
  • Materials
  • Real Estate
  • Utilities

Chart Patterns

  • Bullish Flag
  • Bearish Flag
  • Double Bottom
  • Double Top
  • Cup and Handle
  • Head and Shoulders
  • Ascending Triangle
  • Descending Triangle
  • Symmetrical Triangle
  • Falling Wedge
  • Rising Wedge
  • Rounding Bottom
  • Rectangle
  • Diamond
  • Broadening Formation

Platform

  • About
  • Methodology
  • Learn Patterns
  • Disclaimer
  • Play: Identify Pattern

Partners

  • TradingView
  • TrendSpider

© 2026 ChartPattern.io. All rights reserved. Not financial advice.