Back to Patterns
bearish Signal
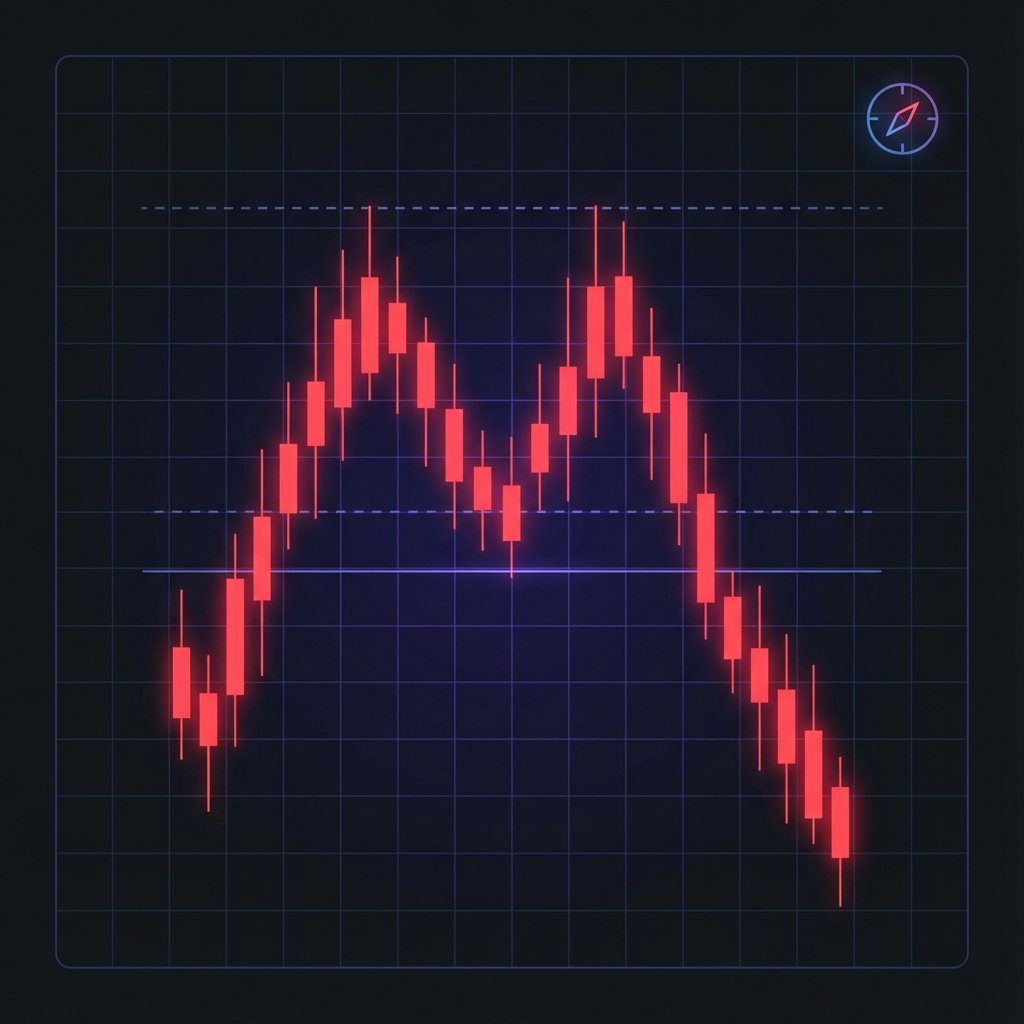
Double Top
A double top is a reversal pattern appearing at the peak of an uptrend. It looks like the letter "M" and signifies that the price has failed to break a specific resistance level twice.
How to Trade
Sell or enter a short position when the price breaks below the neckline (the trough between the two peaks).
Market Psychology
After a strong run, the price hits a ceiling. The second attempt to break higher fails, showing that buyers are losing momentum and that a trend reversal is imminent.
Next Lesson
Cup and Handle
Technical Diagram
This visual represents the ideal candle formation and breakout points for the Double Top pattern.