Back to Patterns
neutral Signal
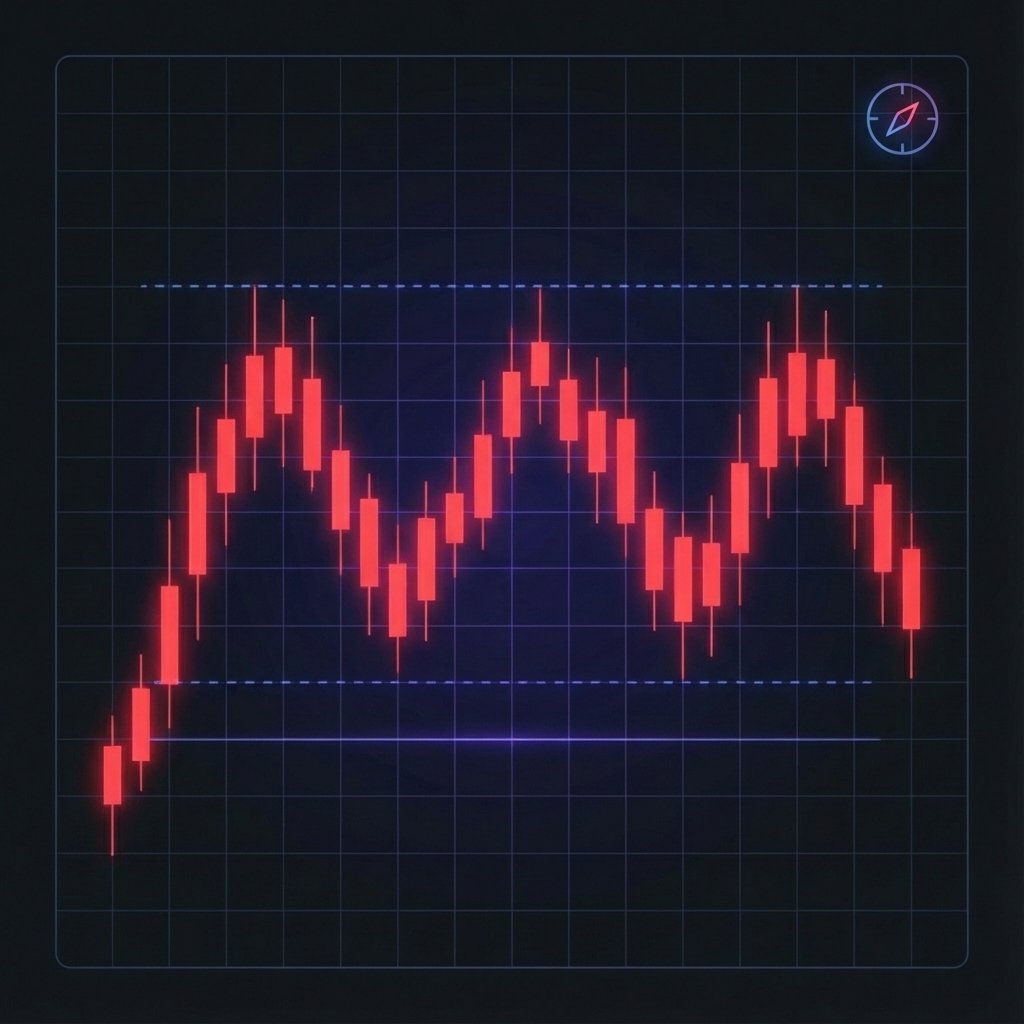
Rectangle
A rectangle pattern forms when price bounces between a horizontal support and resistance level, creating a range-bound trading zone. It can break in either direction.
How to Trade
Trade the breakout: go long if price breaks above resistance, short if it breaks below support. Alternatively, range traders buy at support and sell at resistance within the pattern.
Market Psychology
The market is in equilibrium between buyers at support and sellers at resistance. When one side finally overwhelms the other, a strong directional move follows.
Next Lesson
Broadening Formation
Technical Diagram
This visual represents the ideal candle formation and breakout points for the Rectangle pattern.