Back to Patterns
bullish Signal
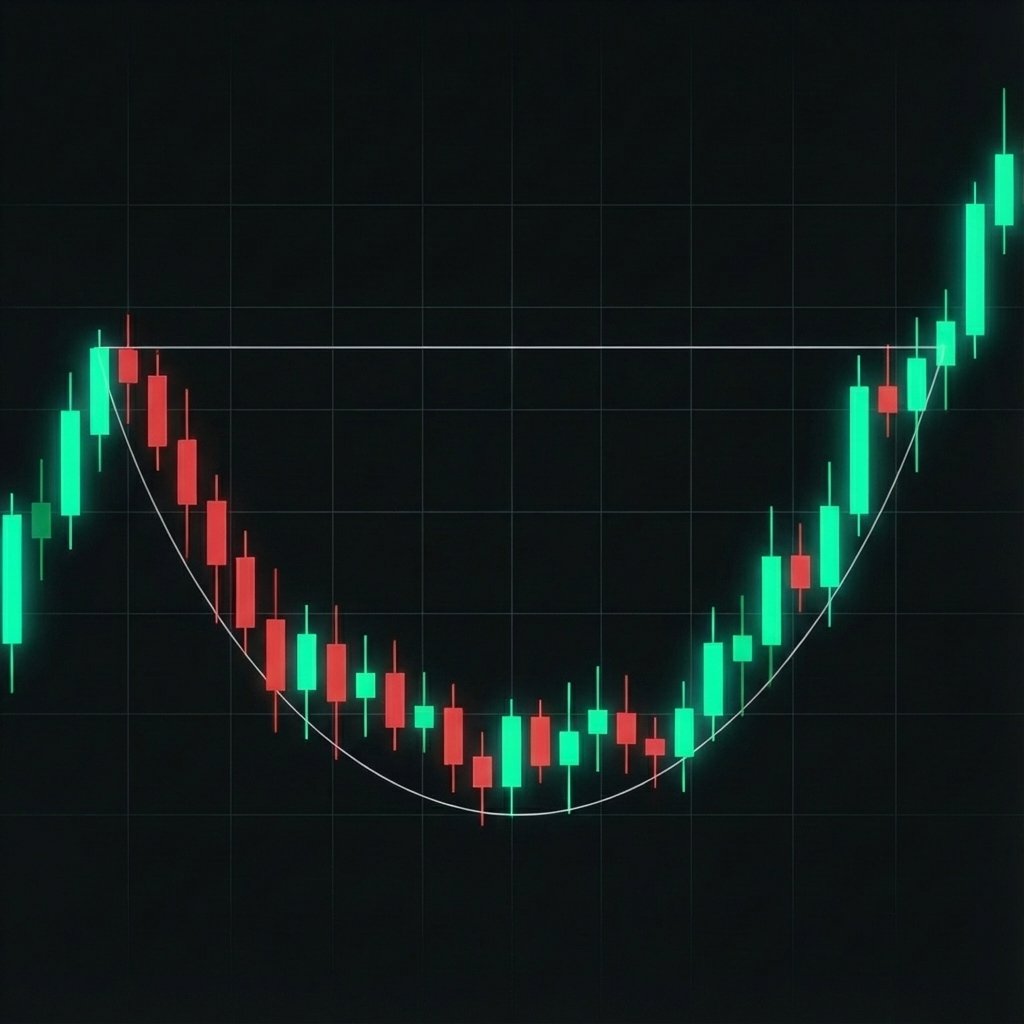
Rounding Bottom
Also known as a "saucer bottom," this is a long-term reversal pattern that shows a gradual shift from a downtrend to an uptrend. The price forms a U-shaped curve over an extended period.
How to Trade
The pattern is confirmed when price breaks above the resistance level at the lip of the saucer. Volume typically increases on the right side of the pattern.
Market Psychology
This pattern represents a slow and steady change in market sentiment. Early sellers gradually exit, new buyers accumulate, and the balance of power shifts from bearish to bullish over time.
Next Lesson
Symmetrical Triangle
Technical Diagram
This visual represents the ideal candle formation and breakout points for the Rounding Bottom pattern.